Stock Market
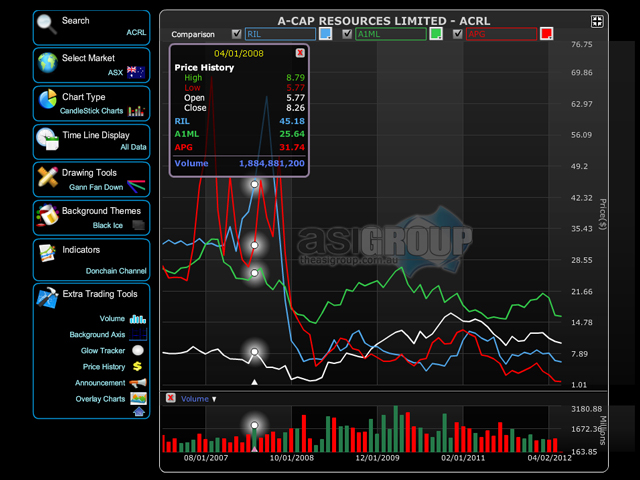
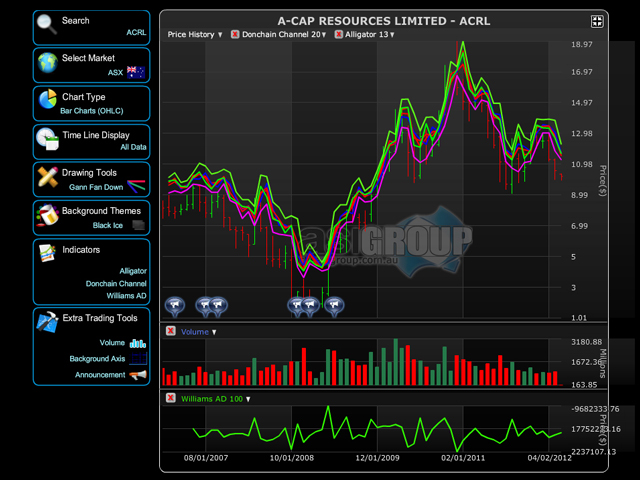
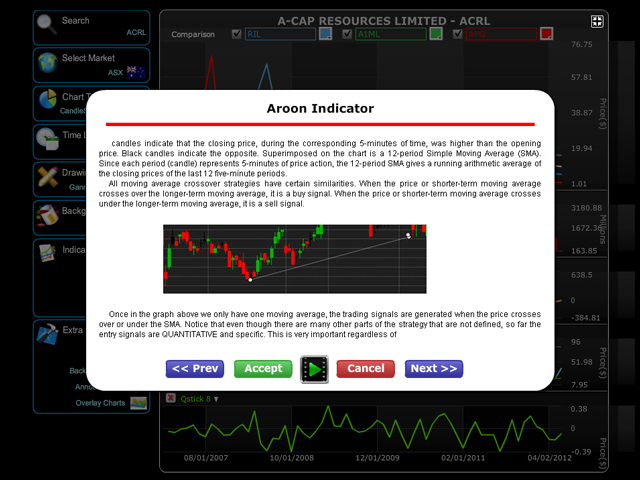
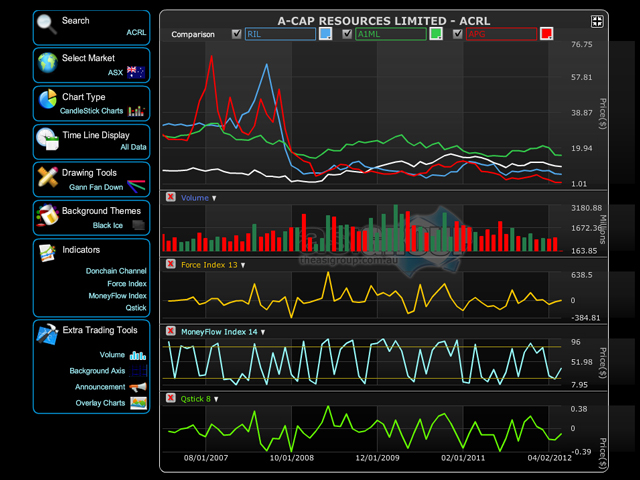
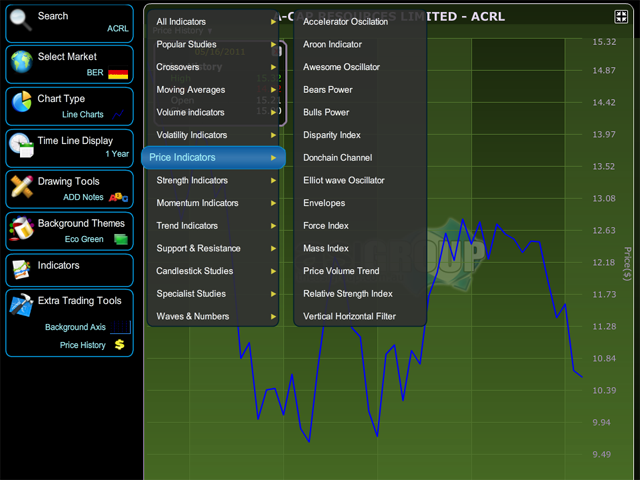
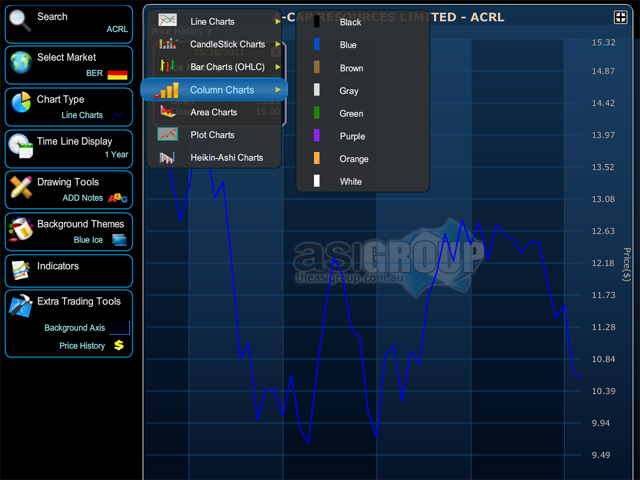
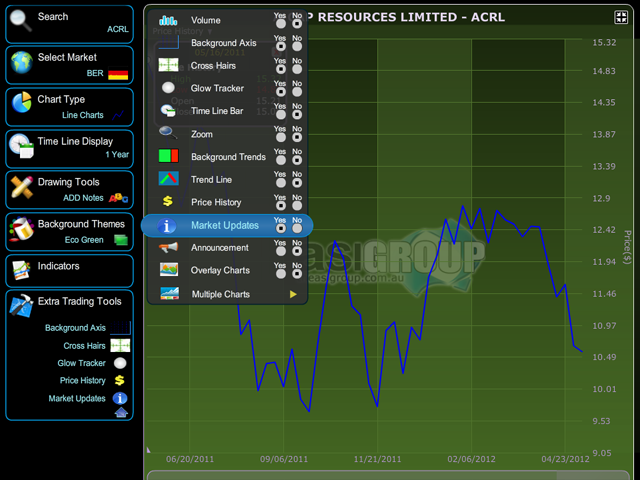
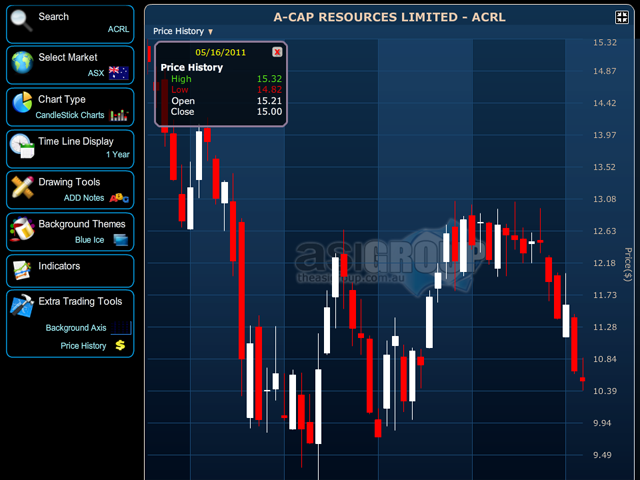
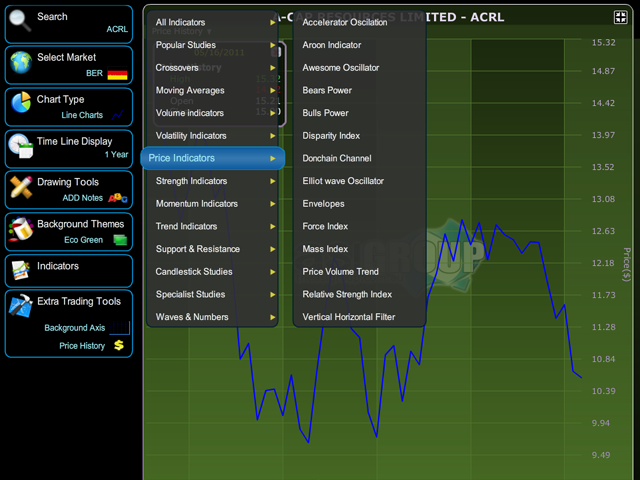
This application is an advanced technical analysis tool for Stock Market. The key features of this application are: Search stock information through Stock Code or Company Name. Select Market for stock information from all over the globe from the list of markets. Various Chart options like line chart, candlestick chart, column chart, bar chart, etc are available for users to analyze the stock information. Using Time Line Display feature the users can filter information according to time like 1 Day, 1 Week, 2 Weeks, 3 Weeks, 1 Month, and 10 Months etc. Various Drawing Tool options like Trend Line, Horizontal line, Vertical line, Fibonacci, Add Notes, Gann Fan up, Gann Fan down etc are available. For user experience various background tools are available like Black Ice, Blue Ice, Deep Ocean, Deep sky, Navy Blue, Grey Ice, Grey Cloud, etc. To help user's analysis various indicators like Popular Studies, Volume Indicators, Crossovers, Price Indicators, Momentum Indicators, Price Indicators, Trend Indicators, Candlestick Studies, Specialist Studies, and Waves & Numbers etc. Extra Trading tools are like Multiple Charts, Background Axis, Time Line Bar, Zoom, Glow Tracker, Cross Hair, Volume, Price History, Market Updates, Overlay Charts, Announcements, Trend Line also available for user's help in analysis
Key Features
various indicators like Popular Studies Volume Indicators Crossovers Price Indicators Momentum Indicators Price Indicators